Step-by-Step Debugging
This section explains how to perform step-by-step debugging in a source code deployment scenario, using the openim-api service of IMServer as an example.
-
Run
docker compose up -dandmage startto start all services. -
Check the console output, as shown below:
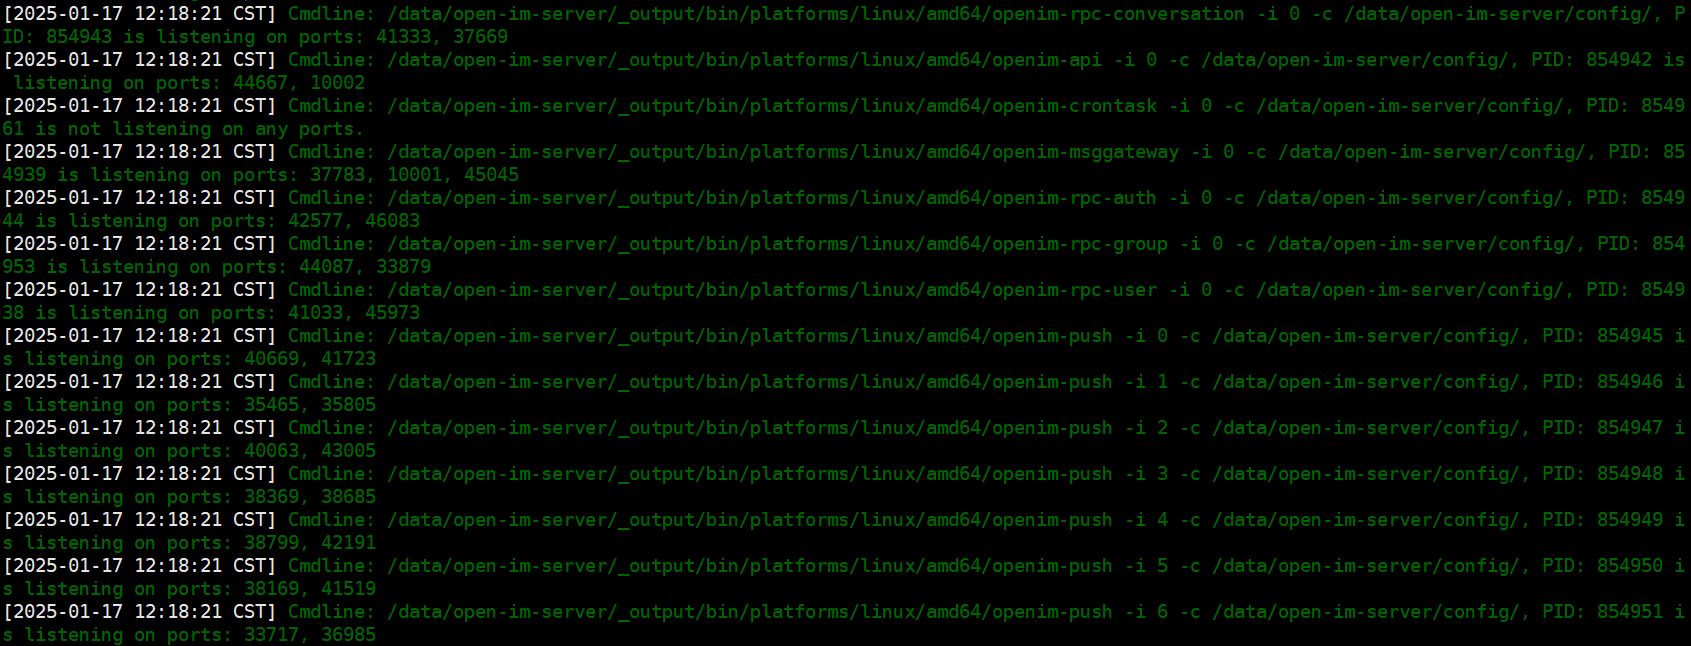
Find the service you want to debug, note its PID, and stop it using the corresponding command.
From the screenshot, the openim-api service has PID 854942. You can stop it with:
kill -9 854942  # Unix-like systems
taskkill /PID 854942 /F  # Windows
-
Find the corresponding service entry point — all entry points are located under the
open-im-server/cmddirectory. Start the service inDebugmode in your IDE. The entry point for theopenim-apiservice isopen-im-server/cmd/openim-api/main.go. -
Set the startup arguments. Using GoLand as an example, click the run arrow and select
Modify Run Configuration, as shown below: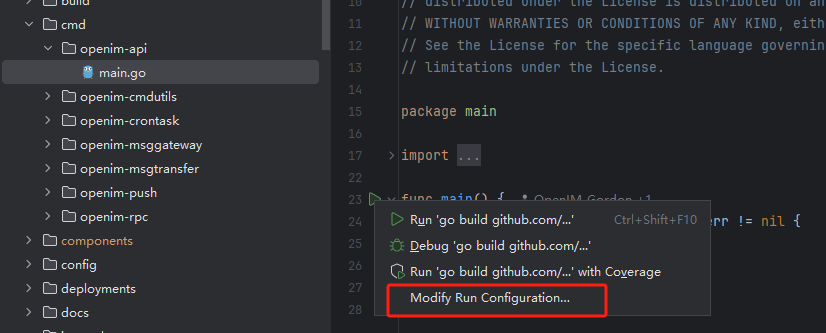
-
Find the
openim-apiservice startup arguments from the console output. Extract the startup command:/data/open-im-server/_output/bin/platforms/linux/amd64/openim-msggateway -i 0 -c /data/open-im-server/config/, where-i 0 -c /data/icey/open-im-server/config/are the startup arguments. Copy and paste them intoProgram argumentsand clickOK, as shown:
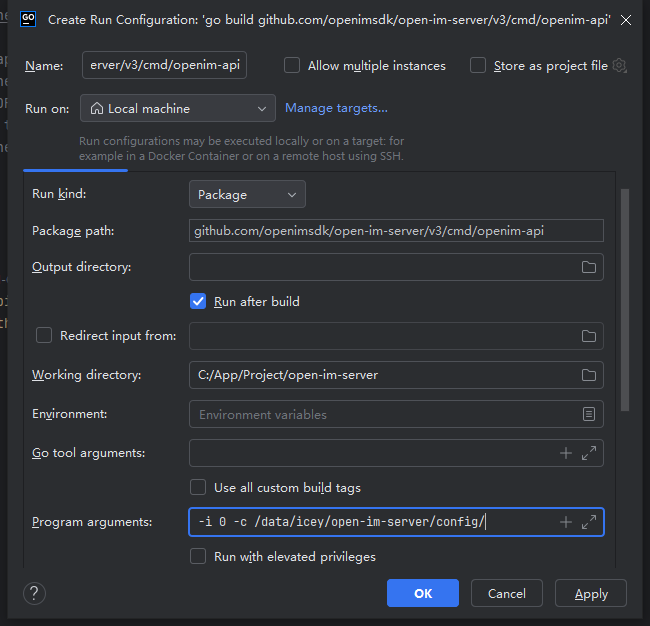
-
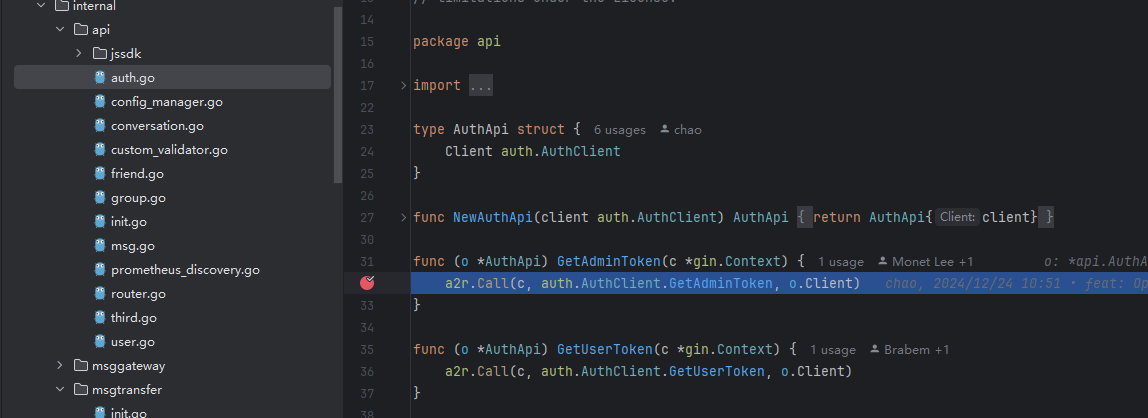
Set breakpoints in the code sections you want to test.
-
Start in
debugmode, as shown: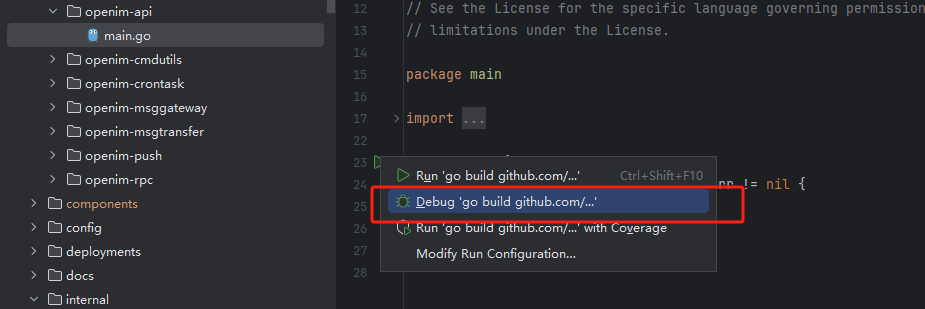
-
When the code reaches a breakpoint, execution will pause, allowing you to perform step-by-step debugging: